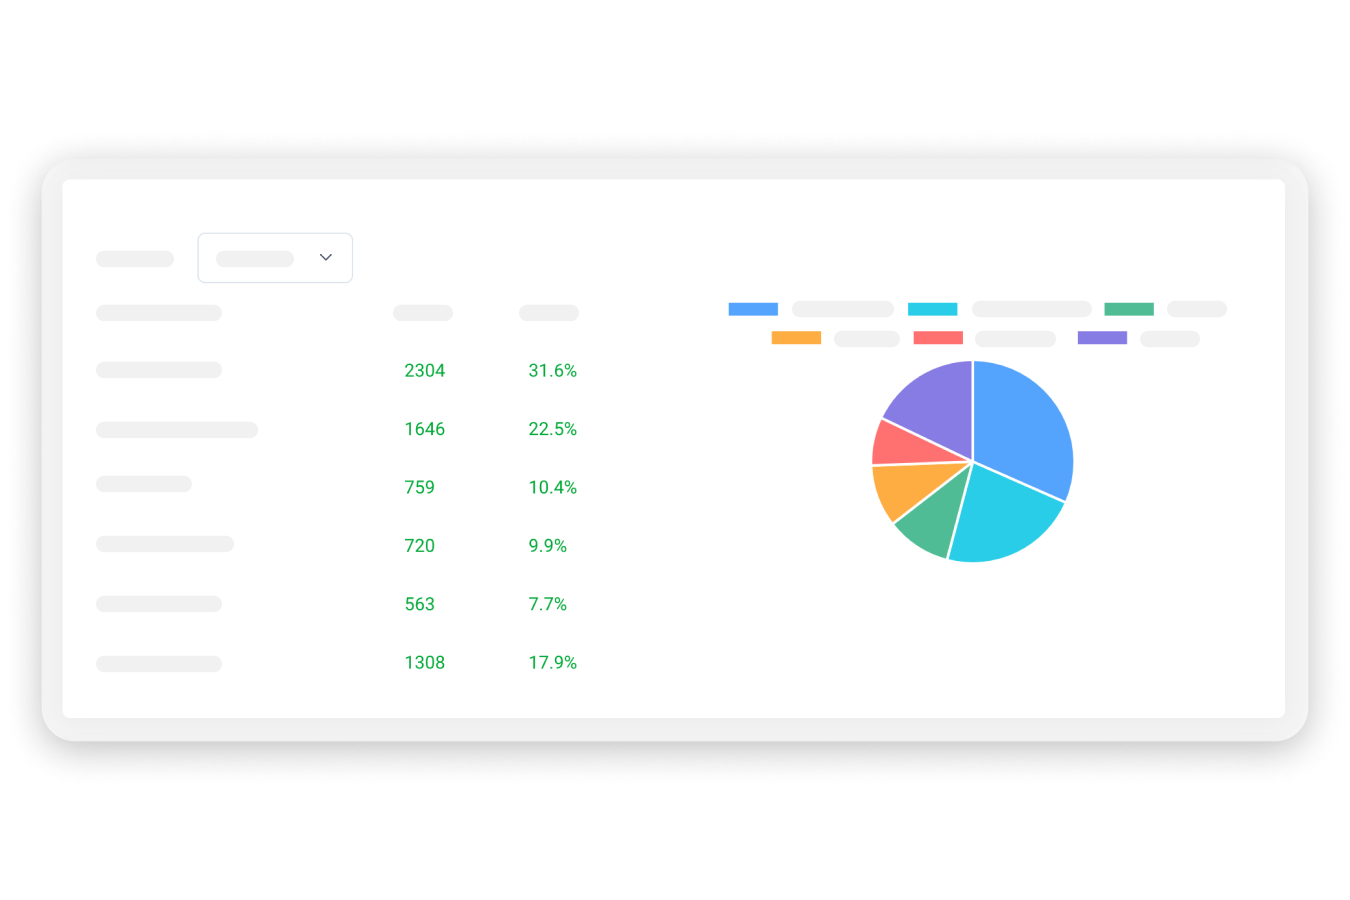

User attribute
User properties are displayed in pie charts to help you depict your user profile quickly.

Data overview of your chat links
You can see the data overview of each chat link, compare them, or check out the details.
Data of individual chat links
For different chat links, we provide you its exclusive data, which helps you learn more about the performance of the links, such as page views and effective interaction.
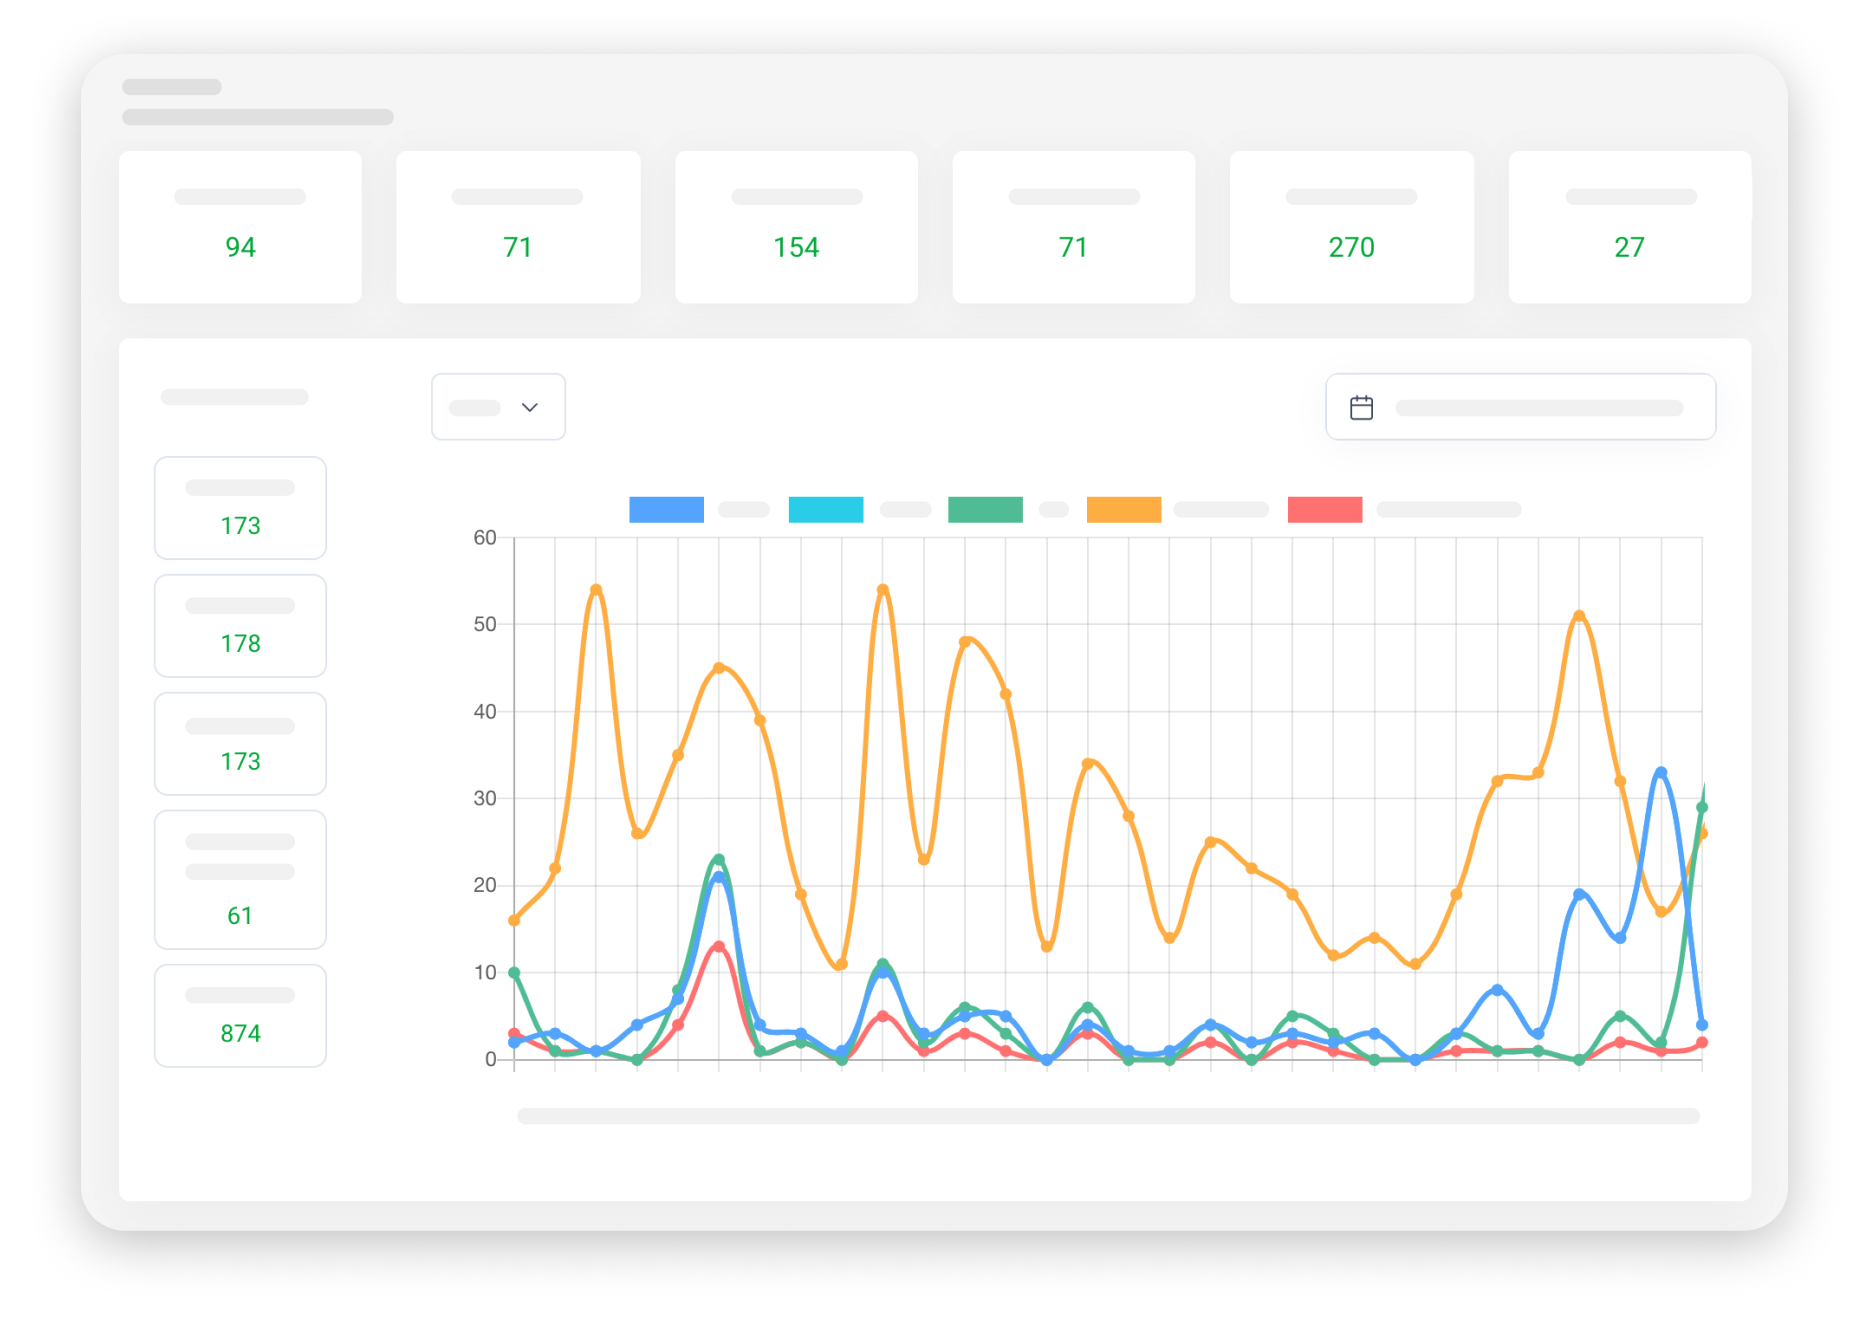
Visualized overview data
Data is displayed in line graph and you can add time filter to get the data you need.
Page views and clicks
Collect your PinBoard page view, click rate, as well as the click-through-rate of the interactive buttons on PinBoard.
Group chat poll data
All the data of the polls held in your group chat are also organized here.
Survey data
The data of both ongoing and ended surveys are fully listed and you can export them.
Explore more features


